MVP Metrics to Track - How to Measure Success
Skip vanity metrics. These 7 MVP metrics actually predict success and help you measure product-market fit from launch day.
The 7 Metrics That Tell You If Your MVP Is Working
Introduction: The Vanity Metric Trap
Congrats - your MVP is live. You’re staring at dashboards:
1,000 pageviews. 200 sign‑ups. 50 downloads.
Feels good, right? The problem: none of these prove your MVP is working.
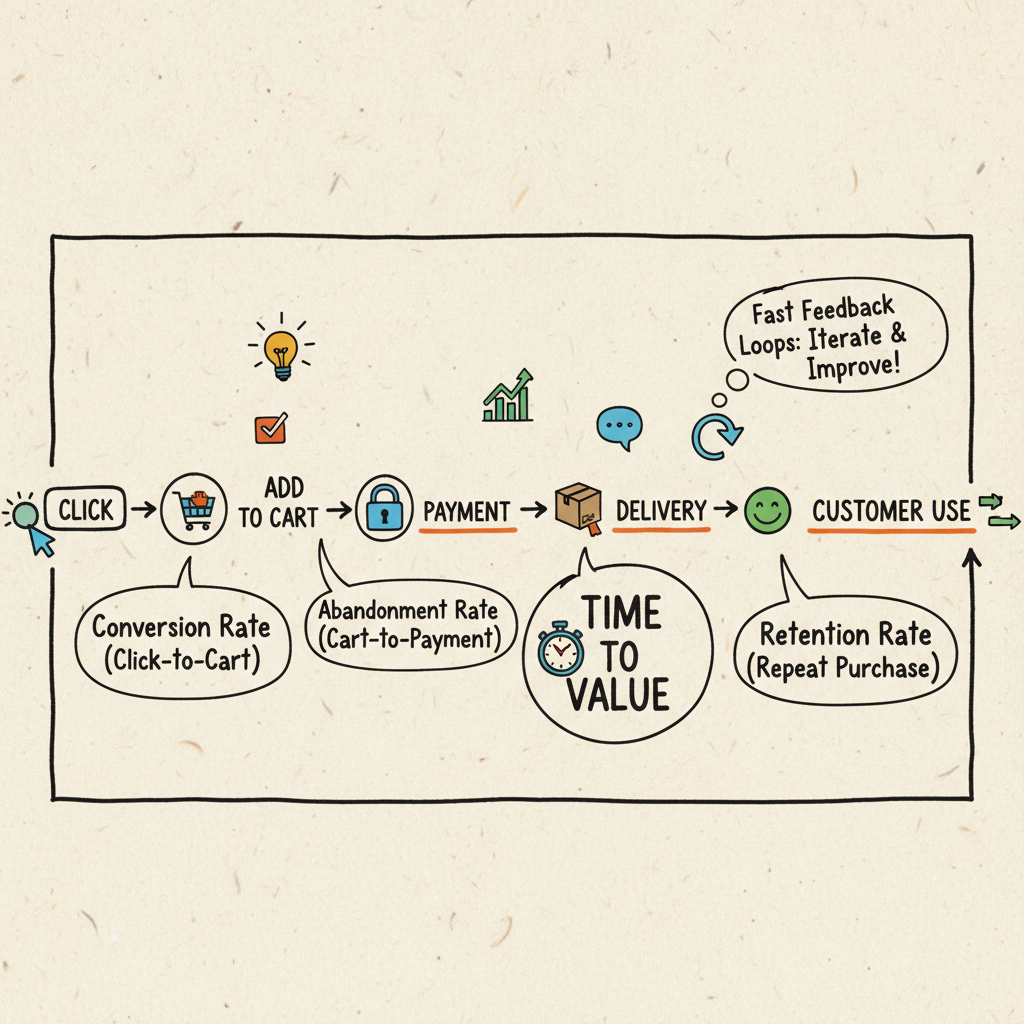
What matters isn’t traffic or downloads. What matters is whether users complete the flow you designed - and whether money or value is exchanged. This post gives you the 7 MVP metrics that actually matter, how to instrument them in a day, and how to read them without fooling yourself.
The guiding idea: measure your thin slice. If your MVP is “Upload transcript → Generate report → Share,” then your metrics live along that path. Not on your homepage.
1) First Contact
Definition: the very first measurable touchpoint (e.g., landing page visit with a UTM, ad click, referral link open, App Store view).
Why it matters: shows which channels create awareness. You can’t improve conversion if you don’t know the entry points.
Examples:
- Landing page pageview with
utm_sourceandutm_campaign - App Store listing view (impressions)
- Link click from a partner email using a tracked parameter
How to instrument:
- Add a single event:
first_contactwith properties:source,campaign,medium,creative, and anexperimentflag if A/B testing. - Capture timestamp and a simple anonymous user id (cookie or device id) before sign‑up.
What good looks like (week 1):
- 3–5 channels sending any traffic
- One clear winner on click‑through rate or cost per first contact
Pitfalls:
- Counting bots or internal views (filter your IPs and preview domains)
- Overfitting to impressions without downstream conversion
2) Activation
Definition: the moment a user starts the core flow - the first action that meaningfully commits them. Think “created first project,” “uploaded first file,” “connected Stripe,” “added first item.”
Why it matters: separates the curious from the committed. A strong activation rate often predicts everything that follows.
Examples:
- Project tool:
project_created - Media tool:
file_uploaded - Finance tool:
connected_bankorconnected_stripe
How to instrument:
- Choose a single activation event and put it behind sign‑up if possible (so it’s tied to a user id).
- Capture minimal properties that shape onboarding (plan, role, import method).
Benchmarks (directional):
- 25–60% of sign‑ups should activate on Day 1 for a simple MVP with a clear task.
Pitfalls:
- Defining activation as “clicked around.” Pick a concrete, irreversible action.
- Hiding activation behind too many steps; reduce friction to reach it.
3) Completion
Definition: the user finishes the core flow you promised. If activation is “started,” completion is “done.”
Why it matters: proves your MVP delivers value. This is the heartbeat metric.
Examples:
- Invoicing:
invoice_generated - Support:
ticket_resolved - Commerce:
checkout_complete - Analytics:
report_ready
How to instrument:
- Emit a single
completed_core_flowevent (or your domain‑specific event) with a reference to the activation object (e.g., project_id, file_id). - Add duration: time from activation to completion in seconds. If you can’t compute server‑side, capture client timestamps at both steps and subtract.
Completion rate:
- Define a simple funnel: Activation → Completion
- Target an initial 30–70% completion for narrow MVPs; if you’re <20%, you have friction or unclear value.
Pitfalls:
- Counting partial success as completion.
- Ignoring errors/timeouts that block completion (log a
core_flow_errorwith error class and surface area).
4) Conversion (Money Moment)
Definition: someone pays - subscription, one‑time purchase, credit top‑up, or pilot invoice.
Why it matters: strongest validation. Even $1 is a stronger signal than 1,000 free users.
Examples:
payment_succeeded(Stripe event mirrored into your analytics)plan_upgradedinvoice_paid
How to instrument:
- Use your payment provider’s webhooks as the source of truth; forward a sanitized event into product analytics.
- Store amount, currency, plan, and whether it’s test or live mode.
Conversion rate:
- Don’t obsess over “Sign‑up → Pay” on Day 1 unless your product is priced for impulse buys. For B2B MVPs, track “Completion → Pay” within 14–30 days.
Pitfalls:
- Counting trial starts as conversion; separate
trial_startedfrompayment_succeeded. - Double‑counting renewals as new conversions.
5) Retention
Definition: do they come back a second time? Easiest form: repeat activation or repeat completion within a time window (D7/D30).
Why it matters: sticky MVPs get used again. If users vanish after one try, you may have curiosity, not demand.
Ways to define quickly:
- Same user triggers activation or completion again within 7 days (D7) and 30 days (D30).
- Or: user performs any “active use” event on 2+ distinct days in the first 7 days.
Targets (directional, MVP stage):
- D7 Retention: 15–35% for tools that fit weekly workflows; higher for daily utilities.
- D30 Retention: 10–25% for early B2B tools; consumer can vary widely.
Pitfalls:
- Using logins as retention; measure meaningful actions.
- Comparing across products with different cadences (weekly vs monthly jobs).
6) Referral / Word of Mouth
Definition: do users bring in others, or does usage create invites inherently?
Why it matters: when people tell friends, the problem is real - and your product likely solved it well enough to mention.
Quick measures:
- % of sign‑ups with a non‑paid referral source (
utm_source=referral,?ref=params, invite links) - Count of
invite_sentandinvite_accepted - K‑factor proxy: invites accepted per active user in a week
How to instrument:
- Issue per‑user invite links; capture
referrer_user_idon sign‑up. - Add a lightweight “share” loop (copy link, email invite) in the completion screen.
Pitfalls:
- Mistaking partner traffic for organic word of mouth; tag partner sources separately.
- Incentivizing low‑quality referrals (e.g., giveaways that don’t correlate to use).
7) Speed of Feedback
Definition: how quickly do you learn? Measure the loop from event → insight → change in the product.
Why it matters: MVPs die when feedback loops are too slow. If it takes six months to know if something worked, that’s not an MVP.
Three simple cycle‑time metrics:
- Time to first value (TTFV): sign‑up → completion; aim to shrink this every week.
- Time to fix: bug opened on core flow → fix shipped.
- Time to decision: insight logged → change shipped behind a flag.
How to instrument:
- Track timestamps on completion and on deploys to compute TTFV trend.
- Maintain a lightweight “insight log” (Notion/Sheet) with created_at and shipped_at; compute median.
Pitfalls:
- Over‑engineering; you don’t need Jira dashboards. A sheet works for Sprint 1.
Cross‑Cutting Signals That Help You Decide Faster
These aren’t part of the “7,” but they sharpen decisions:
- Time to set up: account creation → first activation; if this is >10 minutes for a simple tool, you have friction.
- Error budget: weekly count of core‑flow errors; trend down aggressively.
- Support p95 response time: if you offer pilots, reply fast; product quality feels higher when support is tight.
Instrumentation Playbook (Day‑1 Setup)
You can wire basic product analytics in under an hour. Keep it boring.
- Pick one tool: PostHog, Amplitude, or a minimal custom events table.
- Define 7 events:
first_contact,activated,completed_core_flow,payment_succeeded,invite_sent,invite_accepted,core_flow_error. - Attach minimal properties only: source/campaign, plan, role, object ids, amounts, and durations.
- Standardize user ids immediately after sign‑up; backfill anonymous id as an alias.
Event naming tips:
- Use past‑tense verbs (
created,uploaded,generated). - Keep names domain‑specific where helpful (e.g.,
report_generated) but map them to the 7 concepts in your own cheat sheet.
Server vs client:
- Client: first contact, activation click, UI errors.
- Server: completion (safer), payments, durable failures.
Reading the Numbers: A Simple Weekly Ritual
Every Friday, review a one‑page doc or dashboard with:
- Volumes by step: First contact → Activation → Completion → Conversion
- Rates: Activation rate, Completion rate, Pay rate
- Retention: D7 and D30 for cohorts that reached completion
- Referrals: % of new sign‑ups from invites/ref links
- Speed: median TTFV; median time to fix core‑flow bugs
Ask three questions:
- Where is the biggest drop‑off relative to our promise?
- What is the cheapest change we can make this week to move one number?
- What did we learn from support tickets, emails, and calls that aligns with the numbers?
Ship one change per week to move one metric. Small levers compound.
Case Study: Transcript → Report MVP (30 Days)
Context: a lightweight tool that turns audio transcripts into a structured report.
Plan: 14‑day sprint. Promise: “Upload a transcript and get a publish‑able report in under 10 minutes.”
Metrics after 30 days:
- 30 sign‑ups (first contact) - from a mix of LinkedIn posts and a small newsletter mention
- 12 uploads (activation)
- 10 reports generated (completion)
- 2 Stripe payments (conversion)
- 7 second sessions (retention)
- 3 invites sent; 1 accepted (referral)
- Median time to first value: 8m 40s (speed)
Reading it:
- Activation is low (12/30) relative to sign‑ups; onboarding likely unclear.
- Completion is good (10/12) once started - the core value lands.
- Conversion is small but real (2 paid) - prioritize tightening activation and checkout friction.
What we changed in Week 5:
- Added a 60‑second sample video + demo transcript to eliminate “blank page” fear.
- Moved pricing clarity into the flow (show price before upload, not after).
- Added a one‑click invite at the success screen with a pre‑filled email.
Week 6 results:
- 25 sign‑ups → 18 uploads → 15 completions → 5 payments; D7 retention moved from 23% to 31%.
Lesson: work the bottleneck you can reach fastest. Here, activation.
How to Build Your MVP Metrics Dashboard (Template)
You don’t need Looker to start. A Notion or Google Sheet is enough. Here’s a simple structure you can copy.
Sheet tabs:
- Inputs: paste weekly counts from your analytics tool (or export CSVs)
- Cohorts: a simple table of users by week of completion and whether they came back by D7/D30
- Funnel: a weekly funnel with counts and rates
- Notes: your Friday decisions and shipped changes
Columns to include:
- week_start (date)
- first_contact (count)
- activated (count)
- completed (count)
- paid_users (count)
- d7_retained (count)
- d30_retained (count)
- referrals (count)
- invites_accepted (count)
- ttfv_seconds (median)
Computed fields:
- activation_rate = activated / signups
- completion_rate = completed / activated
- pay_rate = paid_users / completed (or signups, depending on model)
- d7_retention_rate = d7_retained / completed
- k_factor_proxy = invites_accepted / activated
- ttfv_minutes = ttfv_seconds / 60
Weekly review checklist:
- Validate data sanity (no sudden zeros due to tracking)
- Identify the steepest funnel drop
- Pick one change to ship next week; write it in Notes with an owner
- Set a micro‑target (e.g., +10% activation) and review next Friday
Common Traps (And How to Avoid Them)
- Chasing “north star” buzzwords before you have a working core flow. Your north star is completion, not MAUs.
- Counting pageviews and logins as success. Only meaningful actions matter.
- Measuring too much. Seven numbers are plenty in Sprint 1.
- Delaying instrumentation. Add events now; you can refactor names later.
- Ignoring qualitative signals. Numbers tell you where; conversations tell you why.
Category‑Specific Notes (Quick Hits)
- Marketplaces: Activation may be two‑sided. Track seller activation and buyer activation separately; define completion on both sides (listing created; purchase completed). Measure time to first transaction.
- Productivity tools: Retention is king. Tie retention to a recurring job (weekly report, daily standup). Add heartbeat nudges only after the core flow works.
- Fintech: Conversion must reconcile with provider webhooks; treat payment provider as the source of truth. Add a
reconciliation_mismatchalert if your counts drift. - AI‑assisted tools: Measure “assisted edit” rate - how often the user accepted or lightly edited the AI output, not just generated content.
Implementation Notes for Non‑Technical Founders
- Ask your builder to wire the seven events as part of the MVP definition of done.
- Request a 1‑pager with event names, properties, and where they’re emitted.
- Insist on a Day‑14 demo with a mini dashboard (can be a Sheet) showing the seven numbers.
If a vendor can’t deliver basic instrumentation, they’re not shipping a production‑ready MVP.
Key Takeaway
The right metrics prove demand. Forget vanity downloads. Focus on completion, conversion, and retention - and how fast you learn. If you track these seven from Day 1, you’ll know exactly where to push next week.
The MVP Metrics Dashboard (Lead Magnet)
I built a Notion/Sheet template with these 7 metrics:
- First contact
- Activation
- Completion
- Conversion
- Retention
- Referral
- Feedback loop
👉 Download the MVP Metrics Dashboard Template here.
CTA
Grab the MVP Metrics Dashboard Template and book a 20‑min scope call.
Visit weekonelabs.com.
Building an MVP? Week One Labs ships custom-coded SaaS and mobile MVPs in fixed-price 14-day sprints. Book a free scope call to get a plan for your build.